Grouped Frequency Table for Continuous Data
Grouped Frequency Table
Here we will learn about grouped frequency tables, including what grouped frequency tables are and how to make them.
There are also frequency table worksheets based on Edexcel, AQA and OCR exam questions, along with further guidance on where to go next if you're still stuck.
What is a grouped frequency table?
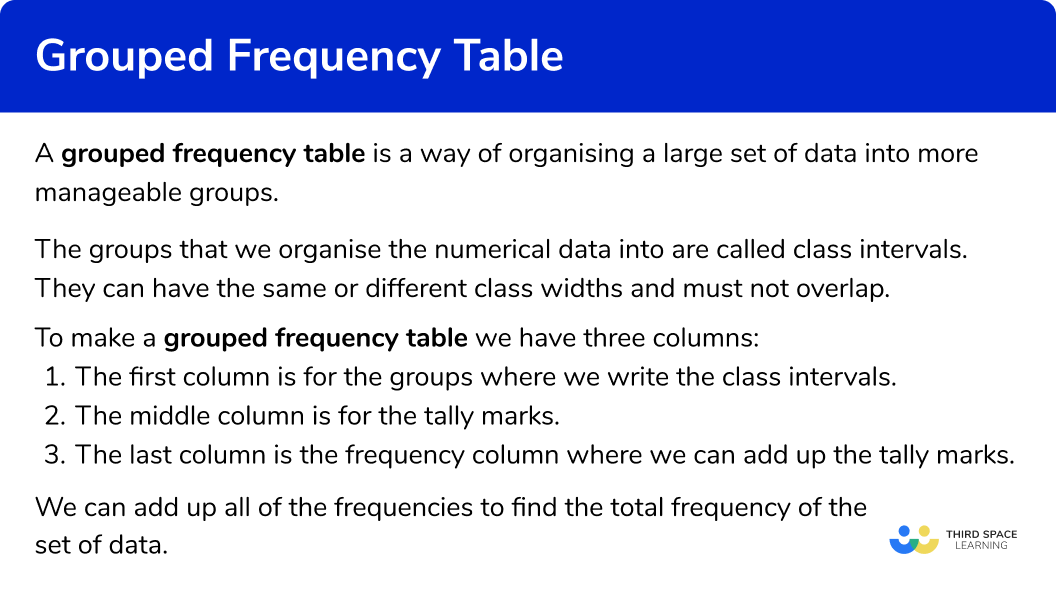
A grouped frequency table (grouped frequency distribution) is a way of organising a large set of data into more manageable groups.
The groups that we organise the numerical data into are called class intervals. They can have the same or different class widths and must not overlap.
To make a grouped frequency table we have three columns:
- The first column is for the groups where we write the class intervals.
- The middle column is for the tally marks.
- The last column is the frequency column where we can add up the tally marks.
We can add up all of the frequencies to find the total frequency of the set of data.
E.g.
Here are the number of marks scored by 20 students in a test.
| 6 | 9 | 11 | 14 | 19 |
| 7 | 4 | 8 | 12 | 15 |
| 3 | 9 | 11 | 10 | 18 |
| 7 | 9 | 12 | 13 | 17 |
They can be organised into a grouped frequency table like this:

Organising the grouped data will help us to draw graphs and analyse it.
We can use grouped frequency tables to find different averages.
Step-by-step guide: Averages from frequency tables
What is a grouped frequency table?
How to make a grouped frequency table
In order to make a grouped frequency table:
- Go along the set of data and mark off each item with a tally mark in the table.
- Fill in the frequency column.
- Find the total frequency.
How to make a grouped frequency table
Grouped frequency table worksheet
Get your free grouped frequency table worksheet of 20+ questions and answers. Includes reasoning and applied questions.
COMING SOON
Grouped frequency table worksheet
Get your free grouped frequency table worksheet of 20+ questions and answers. Includes reasoning and applied questions.
COMING SOON
Grouped frequency table examples
Example 1: whole numbers
Sort these 20 items into the grouped frequency table.
| 5 | 9 | 11 | 17 | 12 |
| 6 | 4 | 8 | 9 | 27 |
| 2 | 12 | 31 | 35 | 16 |
| 13 | 10 | 2 | 32 | 29 |

- Go along the set of data and mark off each item with a tally mark in the table.

2 Fill in the frequency column.
Add up the tally marks and fill in the frequency column.

3 Find the total frequency.
Add the frequencies in the frequency column to find the total frequency.

Example 2: whole numbers
Sort these 25 items into the grouped frequency table.
| 4 | 7 | 10 | 13 | 20 |
| 21 | 12 | 4 | 2 | 12 |
| 16 | 17 | 19 | 23 | 21 |
| 22 | 24 | 15 | 20 | 19 |
| 8 | 6 | 11 | 17 | 21 |

Go along the set of data and mark off each item with a tally mark in the table.

Fill in the frequency column.
Add up the tally marks and fill in the frequency column.

Find the total frequency.
Add the frequencies in the frequency column to find the total frequency.

Example 3: whole numbers
Sort these 25 items into the grouped frequency table.
| 10 | 43 | 25 | 34 | 31 |
| 9 | 25 | 30 | 28 | 12 |
| 26 | 19 | 11 | 8 | 35 |
| 41 | 28 | 19 | 8 | 21 |
| 20 | 47 | 32 | 28 | 21 |

Go along the set of data and mark off each item with a tally mark in the table.
Be careful to check the inequality signs to see which numbers are included in the interval.
E.g.
The item '10' would be in the first group as the class interval includes 10 .

Fill in the frequency column.
Add up the tally marks and fill in the frequency column.

Find the total frequency.
Add the frequencies in the frequency column to find the total frequency.

Example 4: decimals
Sort these 15 items into the grouped frequency table.
| 5.7 | 9.6 | 12.5 | 16.3 | 12.1 |
| 5.4 | 4.9 | 8.7 | 9.0 | 21.2 |
| 24.5 | 6.6 | 34.3 | 36.7 | 16.2 |

Go along the set of data and mark off each item with a tally mark in the table.
Be careful to check the inequality signs to see which numbers are included in the interval.

Fill in the frequency column.
Add up the tally marks and fill in the frequency column.

Find the total frequency.
Add the frequencies in the frequency column to find the total frequency.

Example 5: decimals
Sort these 15 items into the grouped frequency table.
| 19.2 | 23.4 | 12.6 | 23.1 | 19.9 |
| 17.3 | 20.5 | 14.1 | 21.8 | 13.0 |
| 6.3 | 7.9 | 20.5 | 23.6 | 19.0 |

Go along the set of data and mark off each item with a tally mark in the table.
Be careful to check the inequality signs to see which numbers are included in the interval.

Fill in the frequency column.
Add up the tally marks and fill in the frequency column.

Find the total frequency.
Add the frequencies in the frequency column to find the total frequency.

Example 6: decimals
Sort these 20 items into the grouped frequency table.
| 10.6 | 26.8 | 42.9 | 59.8 | 17.5 |
| 21.5 | 29.8 | 8.7 | 13.2 | 29.1 |
| 13.2 | 8.0 | 51.3 | 47.9 | 41.3 |
| 33.4 | 24.6 | 19.2 | 28.3 | 3.6 |

Go along the set of data and mark off each item with a tally mark in the table.
Be careful to check the inequality signs to see which numbers are included in the interval.

Fill in the frequency column.
Add up the tally marks and fill in the frequency column.

Find the total frequency.
Add the frequencies in the frequency column to find the total frequency.

How to design a grouped frequency table
In order to design a grouped frequency table:
- Go along the set of data to find the lowest value and the highest value.
- Split the range of values into about 4 to 6 class intervals with equal width.
- Complete the grouped frequency table.
Designing a grouped frequency table examples
Example 7: designing a grouped frequency table
Sort these 20 items into the grouped frequency table.

Go along the set of data to find the lowest value and the highest value.
The lowest value is 7 and the highest value is 50 .
Spilt the range of values into about 4 to 6 class intervals with equal widths.
The values are from 7 to 50 .
We could do class intervals of 1 to 10, 11 to 20 and so on up to 50 . There will be 5 groups, which is sensible.
Complete the grouped frequency table.

Example 8: designing a grouped frequency table
Sort these 20 items into the grouped frequency table.

Go along the set of data to find the lowest value and the highest value.
The lowest value is 12 and the highest value is 97 .
Spilt the range of values into about 4 to 6 class intervals with equal widths.
The values are from 12 to 97 .
We could do class intervals of 1 to 20, 21 to 40 and so on up to 100 . There will be 5 groups, which is sensible.
Complete the grouped frequency table.

Common misconceptions
- Tally marks
Each tally mark represents one item.
We can group the tally marks into 5 s.

- Classes for grouped frequency tables can be written in different ways
The class intervals used in grouped frequency tables can be written in different ways. Take care with inequalities that the item goes in the correct group.
E.g.
0 to 5
0-5
0\le x<5
0<x \le5
- Deciding your own groups
If you are asked to decide your own group it is sensible to have between about 4 and 6 different classes. The class intervals should also have equal widths. Going up in 5 s, or 10 s or 20 s is also sensible.
Practice grouped frequency table questions


Checking the first group, there are 3 numbers in the 0 to 9 class. Checking the second group, there are 5 numbers in the 10 to 19 class. And finally there are 7 numbers in the 20 to 29 class.


Checking the first group, there are 4 numbers in the 0-4 class. Checking the second group, there are 5 numbers in the 5-9 class. And finally there are 7 numbers in the 10-14 class.


Checking the first group, there are 3 numbers in the 0 \le x<10 class. Checking the second group, there are 6 numbers in the 10\le x<20 class. And finally there are 6 numbers in the 20\le x<30 class.


Checking the first group, there are 5 numbers in the 0\le x<10 class. Checking the second group, there are 7 numbers in the 10\le x<20 class. Finally there are 3 numbers in the 20\le x<30 class.


Checking the first group, there are 4 numbers in the 0\le x<5 class. Checking the second group, there are 5 numbers in the 5\le x<10 class. And finally there are 6 numbers in the 10\le x<15 class.


Checking the first group, there are 3 numbers in the 0\le x<20 class. Checking the second group, there are 8 numbers in the 20\le x<40 class. And finally there are 4 numbers in the 40\le x<60 class.


It is sensible to have 4 to 6 different class intervals. 2 groups is too few, and 8 groups is possibly too many for 20 values. It is also best if the widths of the classes are the same.
Grouped frequency table GCSE questions
1. Akira has carried out a survey to find the number of text messages sent by 20 of her friends last week.
Here are the results.
| 15 | 7 | 19 | 42 | 48 |
| 17 | 9 | 23 | 13 | 27 |
| 19 | 29 | 32 | 38 | 18 |
| 40 | 25 | 35 | 32 | 31 |
Complete the grouped frequency table:

(2 marks)
Show answer

For at least one correct tally or frequency
(1)
For all frequencies correct
(1)
2. Oliver asked 20 people how long in minutes they spent doing their science homework.
Here are his results.
| 17 | 20 | 28 | 35 | 46 |
| 10 | 26 | 39 | 48 | 52 |
| 19 | 23 | 39 | 38 | 41 |
| 38 | 27 | 32 | 40 | 15 |
Complete the grouped frequency table:

(2 marks)
Show answer

For at least one correct tally or frequency
(1)
For all frequencies correct
(1)
3. Ade is surveying the heights of 20 sunflower plants.
He measures them to the nearest centimetre.
Here are the results in metres
| 1.25 | 1.31 | 1.45 | 1.07 | 1.68 |
| 1.35 | 1.26 | 1.19 | 1.70 | 1.79 |
| 1.82 | 1.54 | 1.57 | 1.61 | 1.59 |
| 1.89 | 1.71 | 1.83 | 1.62 | 1.43 |
Complete the grouped frequency table:

(2 marks)
Show answer

For at least one correct tally or frequency
(1)
For all frequencies correct
(1)
Learning checklist
You have now learned how to:
- Complete a grouped frequency table, including integers and decimals
Still stuck?
Prepare your KS4 students for maths GCSEs success with Third Space Learning. Weekly online one to one GCSE maths revision lessons delivered by expert maths tutors.

Find out more about our GCSE maths revision programme.
Source: https://thirdspacelearning.com/gcse-maths/statistics/grouped-frequency-table/
Belum ada Komentar untuk "Grouped Frequency Table for Continuous Data"
Posting Komentar